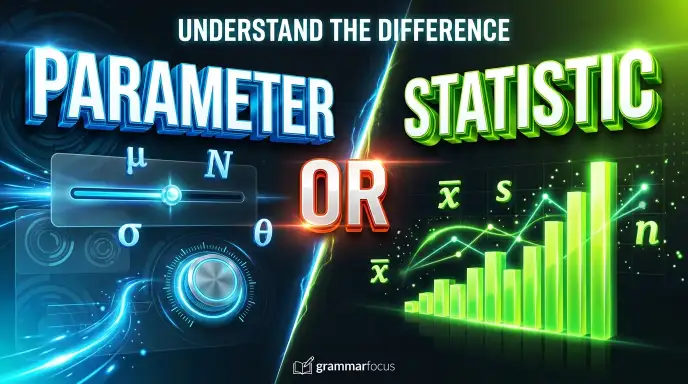
Parameter or statistic are terms used in mathematics and data analysis, but they have different meanings. A parameter describes a whole population, while a statistic describes a sample taken from that population.
Understanding this difference helps you read research papers, interpret surveys, and solve statistics problems correctly. Although both terms describe numerical information, the key difference is the group each value represents.
Parameter or Statistic: Quick Answer
A parameter is a numerical value that describes an entire population. A statistic is a numerical value calculated from a sample of that population.
For example, the average height of every student in a school is a parameter. The average height of 50 students selected from that school is a statistic.
| Feature | Parameter | Statistic |
| Meaning | Describes an entire population | Describes a sample |
| Data source | Every member of the population | A selected group from the population |
| Purpose | Summarizes a population characteristic | Summarizes sample data and can help estimate population values |
| Common symbols | μ\mu, σ\sigma, pp | xˉ\bar{x}, ss, p^\hat{p} |
| Example | Average age of all employees in a company | Average age of 40 selected employees |
| Usually known? | Often unknown when the population is large | Can be calculated from collected sample data |
Definition and Meaning of Parameter or Statistic
What Is a Parameter?
A parameter is a numerical measurement that describes a characteristic of an entire population. In statistics, a population means the complete group being studied.
For example, imagine a company has 2,000 employees. If you calculate the average age of all 2,000 employees, that average is a parameter.
Parameters can describe several population characteristics, including:
- Mean: The average value for the population.
- Proportion: The share of the population with a particular characteristic.
- Standard deviation: How much population values vary around the mean.
- Variance: A measure of the spread of population values.
Researchers often want to know a population parameter but cannot measure every member of the population. They use sample data to estimate it.
What Is a Statistic?
A statistic is a numerical value calculated from sample data. A sample is a smaller group selected from a population for study.
Suppose a university has 10,000 students. A researcher selects 200 students and calculates their average age. That average is a statistic because it comes from a sample rather than the entire student population.
Common statistics include:
- Sample mean: The average of the sample values.
- Sample proportion: The share of the sample with a particular characteristic.
- Sample standard deviation: A measure of variation within the sample.
- Sample variance: A measure of how widely sample values are spread.
Statistics help researchers understand sample data and estimate population characteristics. A statistic may differ from the true population parameter because the sample does not include everyone.
The Origin of Parameter or Statistic
The Origin of Parameter
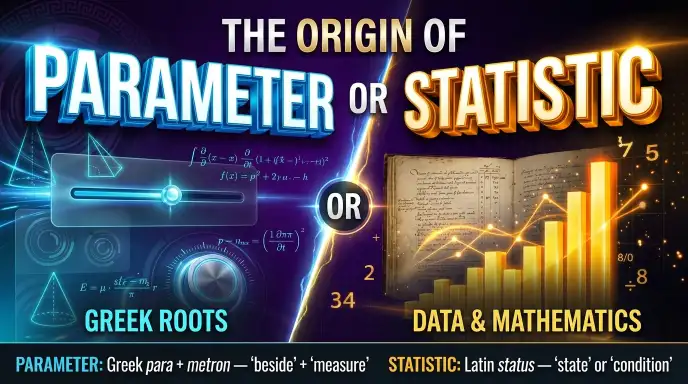
The word parameter comes from Greek roots that relate to measuring and comparison. It entered English through scientific and mathematical usage and became established in mathematics and statistics.
In statistics, a parameter refers to a fixed numerical characteristic of a defined population or probability distribution.
Its value does not change simply because a researcher collects a different sample from that same population.
For example, the true average income of all employees in a company is a population parameter. It may be unknown, but it has a specific value for the population at a given time.
The Origin of Statistic
The word statistic is connected to statistics, a field that developed from the collection and study of numerical information about governments, populations, and societies.
Today, a statistic can be any numerical summary calculated from data. In inferential statistics, sample statistics are especially important because researchers use them to draw conclusions about larger populations.
For example, a survey’s percentage of respondents who support a proposal is a statistic. Researchers may use that result to estimate the level of support in the wider population.
Parameter vs. Statistic: How to Tell Them Apart
The easiest way to distinguish these terms is to ask one question: Does the number describe the whole population or only a sample?
- If it describes the entire population, it is a parameter.
- If it is calculated from a sample, it is a statistic.
Consider a school with 800 students. The average score of all 800 students on an exam is a parameter. The average score of 80 selected students is a statistic.
The numbers may be close, but they do not have to be identical. The sample average can vary depending on which students are selected.
This distinction is important in surveys, scientific research, business reports, and public opinion studies. It helps readers understand what a reported number actually represents.
Parameter or Statistic: Examples in Everyday Research
Real world examples make the difference between a parameter and a statistic easier to understand.
Example 1: Student Grades
A school has 1,000 students.
- The average exam score of all 1,000 students is a parameter.
- The average exam score of 100 selected students is a statistic.
The first value describes the whole student population. The second describes only the selected sample.
Example 2: Customer Satisfaction
A company has 20,000 customers. It sends a survey to 500 customers to learn about their experience.
- The percentage of all 20,000 customers who are satisfied is a parameter.
- The percentage of the 500 surveyed customers who are satisfied is a statistic.
The company can use the survey statistic to estimate customer satisfaction across its full customer base.
Example 3: Employee Salaries
A business employs 300 people.
- The average salary of all 300 employees is a parameter.
- The average salary of 40 selected employees is a statistic.
These examples show that the difference depends on the group represented by the number, not the type of number itself.
Common Mistakes with Parameter or Statistic
People sometimes confuse these terms because both describe numerical information. These are the most common mistakes to avoid.
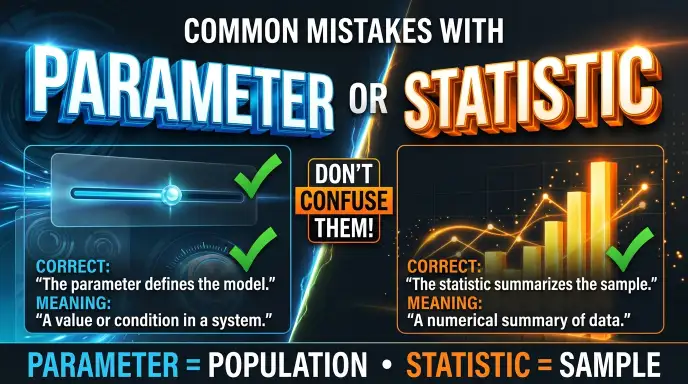
Mistake 1: Calling Every Average a Parameter
An average is not automatically a parameter.
Incorrect: The average of 50 selected students is always a parameter.
Correct: If those 50 students are a sample from a larger group, their average is a statistic.
The group represented by the value determines the correct term.
Mistake 2: Assuming a Statistic Is Always an Estimate
A statistic is a numerical summary calculated from sample data. It can be used to estimate a population parameter, but estimation is not its only purpose. For example, a sample median can simply describe the middle value in the collected data.
Mistake 3: Thinking a Parameter Changes With Every Sample
A population parameter is fixed for a defined population at a particular time. Different samples can produce different statistics, but they do not change the population parameter itself.
For example, the true average age of a company’s current employees remains the same when researchers select different samples, provided the population has not changed.
Mistake 4: Confusing the Population With the Sample
A population is the complete group being studied. A sample is a smaller group selected from it.Before deciding if a value is a parameter or statistic, identify which group the number describes.
Parameter or Statistic in Mathematical Notation
Statistical symbols can help you recognize the difference between population values and sample values.
| Measurement | Population Parameter | Sample Statistic |
| Mean | μ\mu | xˉ\bar{x} |
| Standard deviation | σ\sigma | ss |
| Proportion | pp | p^\hat{p} |
| Variance | σ2\sigma^2 | s2s^2 |
For example, μ\mu represents a population mean, while xˉ\bar{x} represents a sample mean. The sample mean is often used to estimate the population mean.
These symbols are common in statistics textbooks, research papers, and data analysis. Learning them makes formulas easier to read.
Key Takeaway
A parameter describes an entire population, while a statistic describes a sample taken from that population.
For example, the average score of every student in a school is a parameter. The average score of 100 selected students is a statistic.
Remember the simple rule: population = parameter; sample = statistic. This distinction is central to understanding surveys, research findings, and statistical calculations.
Frequently Asked Questions
Q1. What is the main difference between a parameter and a statistic?
Answer. A parameter describes a characteristic of an entire population. A statistic describes a characteristic calculated from a sample.
Q2. Is a sample mean a parameter or a statistic?
Answer. A sample mean is a statistic because it is calculated from sample data. It can also help estimate the population mean.
Q3. Is population standard deviation a parameter?
Answer. Yes. Population standard deviation, usually represented by σ\sigma, is a parameter because it describes variation across the entire population.
Q4. Can a statistic be equal to a parameter?
Answer. Yes. A statistic can have the same numerical value as a population parameter by coincidence or because the sample represents the population very closely. The terms still describe different roles.
Q5. Why do researchers use statistics to estimate parameters?
Answer. Collecting data from every member of a large population can be expensive or impractical. Researchers use sample statistics to estimate population parameters more efficiently.
Q6. Is a percentage a parameter or a statistic?
Answer. It depends on the data used. A percentage calculated for an entire population is a parameter. A percentage calculated from a sample is a statistic.
Q7. What symbols represent parameters and statistics?
Answer. Common parameter symbols include μ\mu, σ\sigma, and pp. Common statistic symbols include xˉ\bar{x}, ss, and p^\hat{p}.
Q8. How can I quickly identify a parameter or statistic in a question?
Answer. First, identify the group being studied. If the value describes the entire population, it is a parameter. If it comes from a sample, it is a statistic.
Conclusion
Parameter or statistic describes two different types of numerical summaries.A parameter represents an entire population, while a statistic describes a sample. Although both provide useful information, they serve different purposes in data analysis.
However, the key difference lies in the group each one describes.To identify the correct term, focus on the group behind the number. This simple habit will help you understand statistical formulas, research reports, and survey results more accurately.
Learn More About Grammar:
- Argentinian or Argentine: The Difference Explained With Examples
- White or Caucasian: Meaning, Differences, and Usage in 2026
- Libel or Slander: How Written and Spoken Defamation Differ

I’m Alex Morgan, an American English writer with 6 years of experience exploring grammar, punctuation, sentence structure, and everyday English usage. I enjoy turning confusing grammar rules into clear, practical explanations that help readers write and communicate with confidence.








2 thoughts on “Parameter or Statistic: Can You Tell Them Apart?”